Data & Analytics
Measure and analyse engagement and participation.

Download detailed reports
Identify trends and themes
Vevox's data report is downloadable as an Excel file via a click of a button. This report enables you to interrogate data to spot recurring themes and to have deeper understanding of your audience and session engagement.

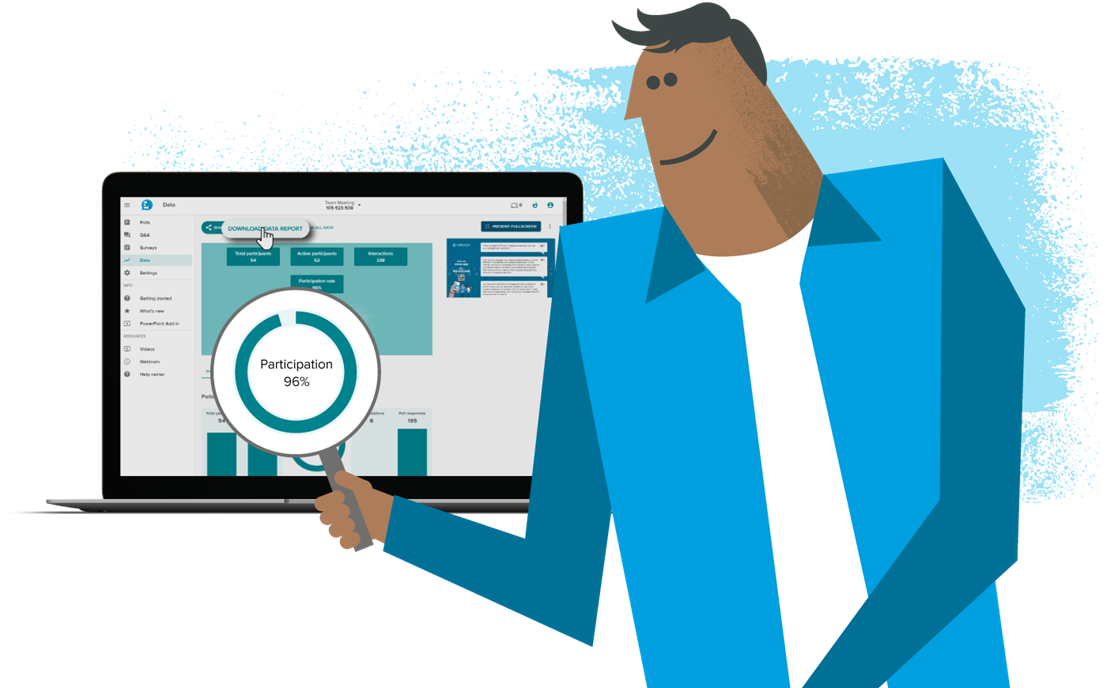
Insights and infographics
Visualise live data
The analytic charts in your Vevox dashboard allows you to see your engagement and participant levels all in real-time. You can save these charts, stats and live poll for you to share with other team members or to review at a later date.

Account analytics
Understand your Vevox usage
Wanting to know the impact of Vevox in your organisation? As an enterprise or institution customer you can view your account usage to see which users or departments are the most active Vevox users.
Excellent tool for Teaching & Learning and beyond! I have used it for teaching, gathering student feedback, conducting remote workshops and interviews. I really like how you can easily download results image instead of having to work thought excel and word cloud has been a really engaging way to present results.
Data & Analytics FAQ's
Common questions
Charts and word clouds are exported as images with a full data report, including per participant breakdowns available as a Microsoft Excel document.
Full account analytics are available for Vevox account admins through their online account dashboard.
You can use Vevox's data and analytics feature for teaching by collecting feedback from students and analyzing it to identify areas where you need to improve. You can also use polls and surveys to engage students and promote active learning.
You can use Vevox's data and analytics feature to identify areas where you need to improve and make data-driven decisions. For example, you can analyze feedback and poll results to identify common themes and adjust your content accordingly.
With Vevox's data and analytics feature, you can collect and analyze a wide range of data, including live feedback, survey responses, poll results, quiz responses and much more. This allows you to gain insights into your audience and session engagement.